R
The Ledger
9-5 Exit Real-Estate Portfolio
Why This Exists

You Didn't Buy Rentals To Keep A Second Job Tracking Them.

Most landlords know their numbers in pieces — a banking app, a mortgage statement, a notebook. What's missing isn't more data. It's one honest number: is this enough to leave my job yet.

"Net cash flow" isn't a vanity metric. It's the size of the paycheck your portfolio is already writing you — you just haven't been reading it that way.

— The idea behind The Ledger
The Core Idea

Every Property Is A Small, Ugly Paycheck.

A job pays you on someone else's schedule. A rental property pays you on its own — messier, easy to ignore, but still a paycheck. The Ledger adds those paychecks up and holds them next to your real one.

Your Portfolio's Monthly Cash Flow$2,150
÷ Your Monthly Take-Home Pay$6,500
= Paycheck Replaced33%
The Same Ledger, Projected Forward

What Does Your Portfolio Look Like In 5–10 Years?

33% replaced today isn't the finish line — it's the starting number. Here's a sample portfolio run forward through rent increases, one refinance-funded reinvestment, and normal amortization. No extra cash from a job, ever.

Now
$2,150/mo
33% replaced
Year 5
$4,200/mo
65% replaced
Year 10
$7,800/mo
120% replaced
Sample portfolio: 3 rentals at Year 0, one refinance-funded reinvestment by Year 6, 3% annual rent growth. Your own numbers — and your own exit year — replace this the moment you add a property.
A Real Walkthrough

What It Actually Looks Like.

01 · Portfolio

Start By Logging What You Own

Purchase price, mortgage, rent, taxes, insurance — one row per property. This is the only manual entry in the whole ledger.
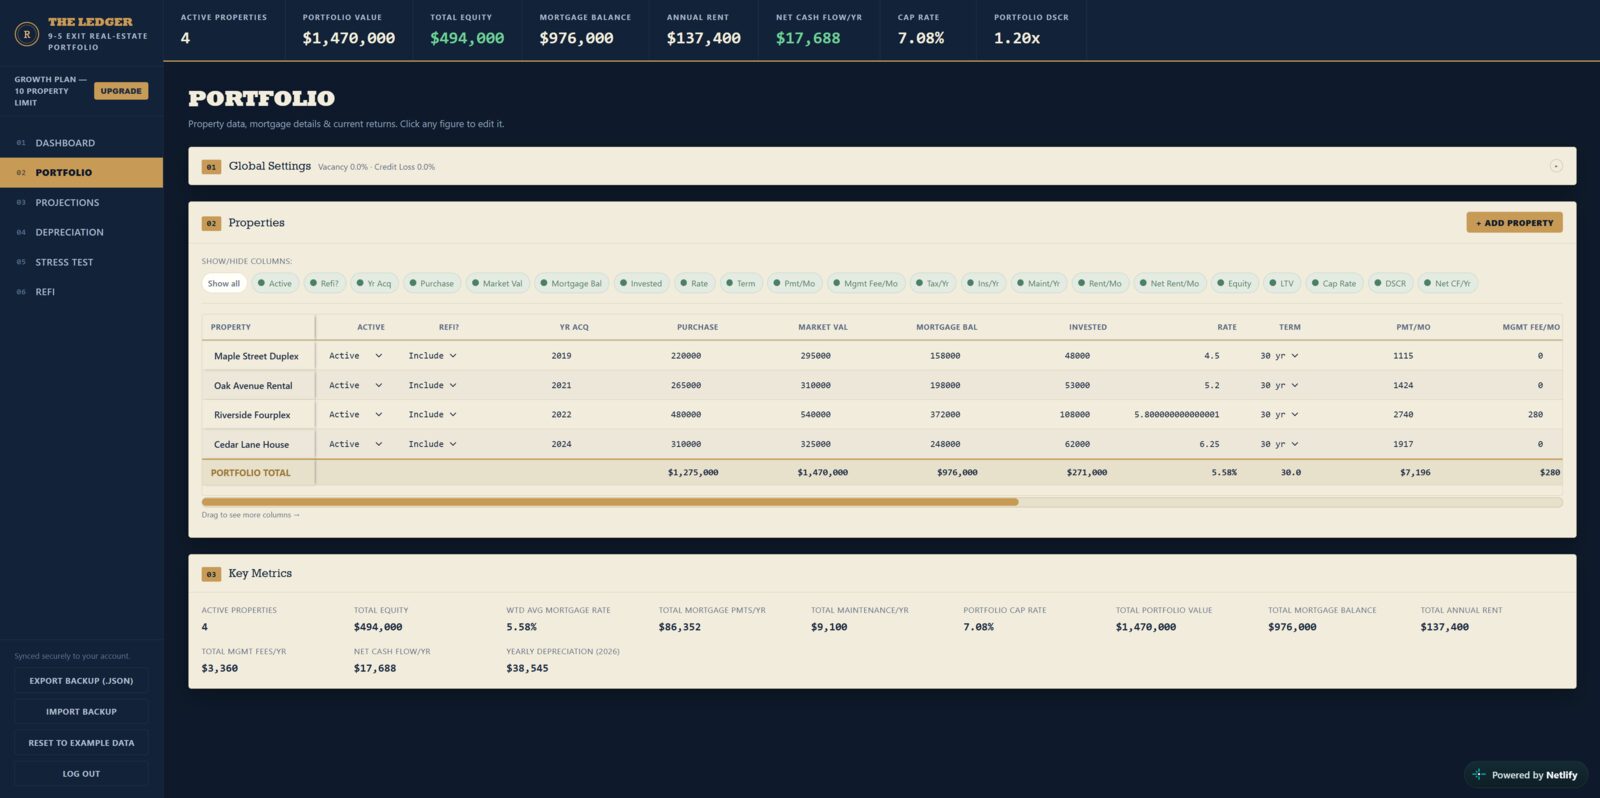
Portfolio tab showing property data entry table with mortgage, rent, and expense fields for four rental properties
02 · Dashboard

Then See The Whole Portfolio At Once

Total value, equity, cap rate, and DSCR at the top. Every property's individual return below it.
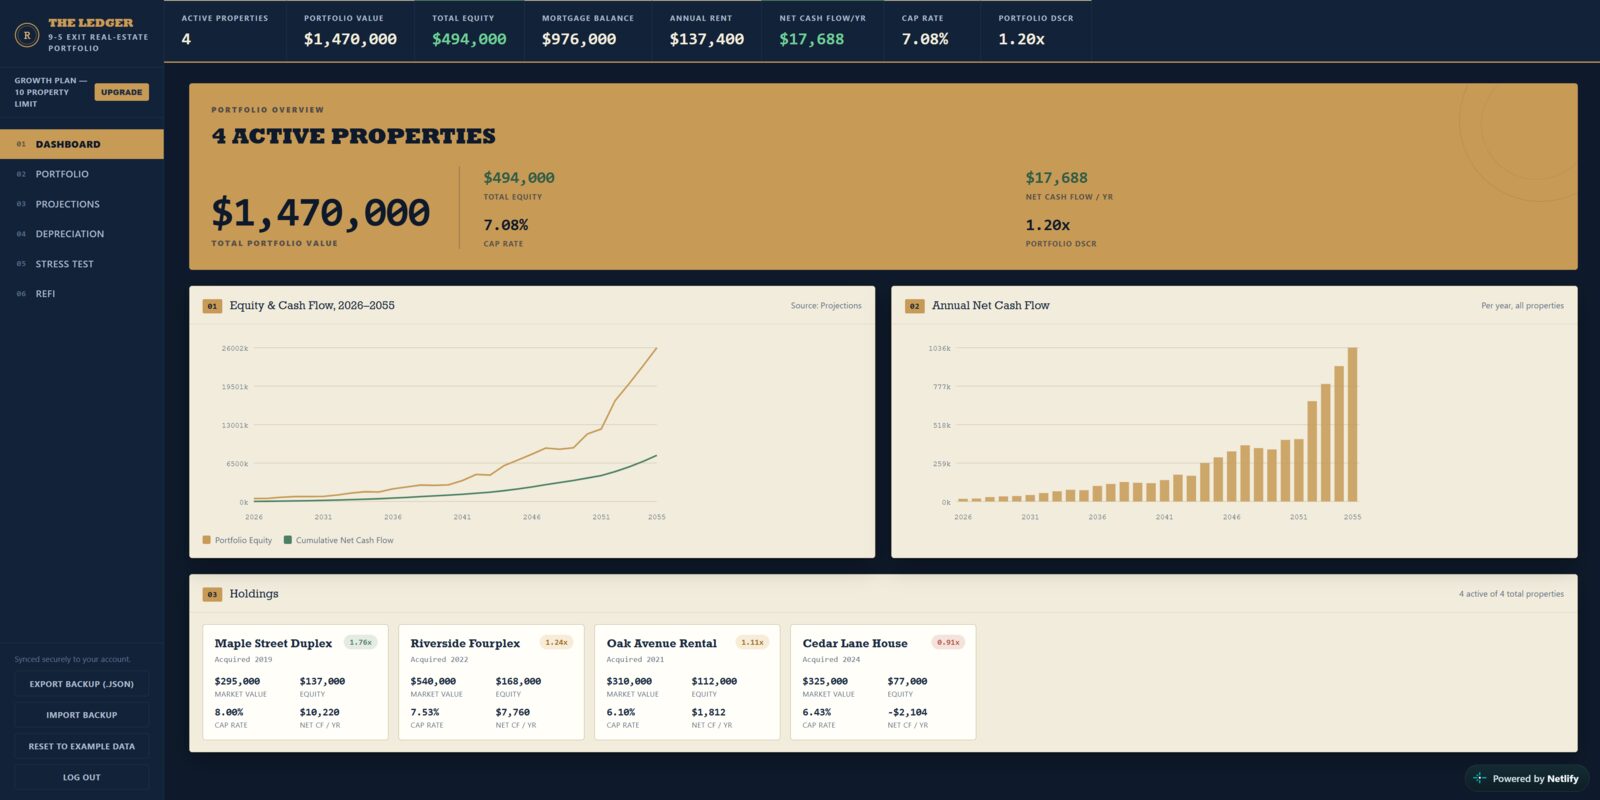
Dashboard tab showing portfolio KPI strip, total value overview, equity and cash flow charts, and individual property holding cards
03 · Projections

Watch The Math Run Forward, Year By Year

Every property's rent, equity, and mortgage balance, projected out to 2055 — not a straight-line guess.
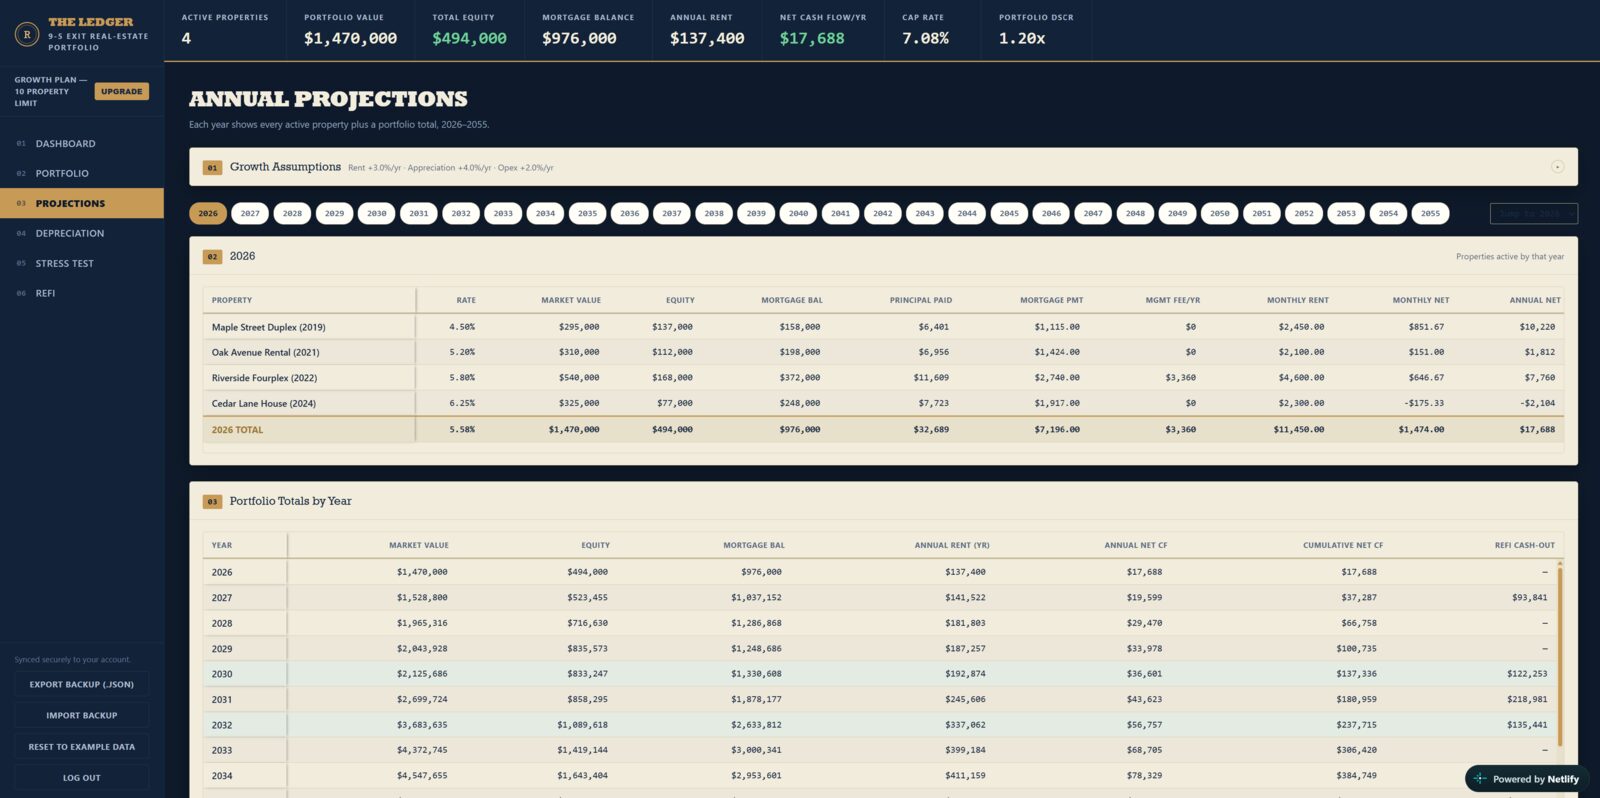
Projections tab showing a year-by-year breakdown table for each property plus a portfolio totals by year table running through 2055
04 · Refi Simulator

See Exactly When Equity Buys The Next Property

Set your refi rules once. The ledger models every cash-out and reinvestment automatically, all thirty years of them.
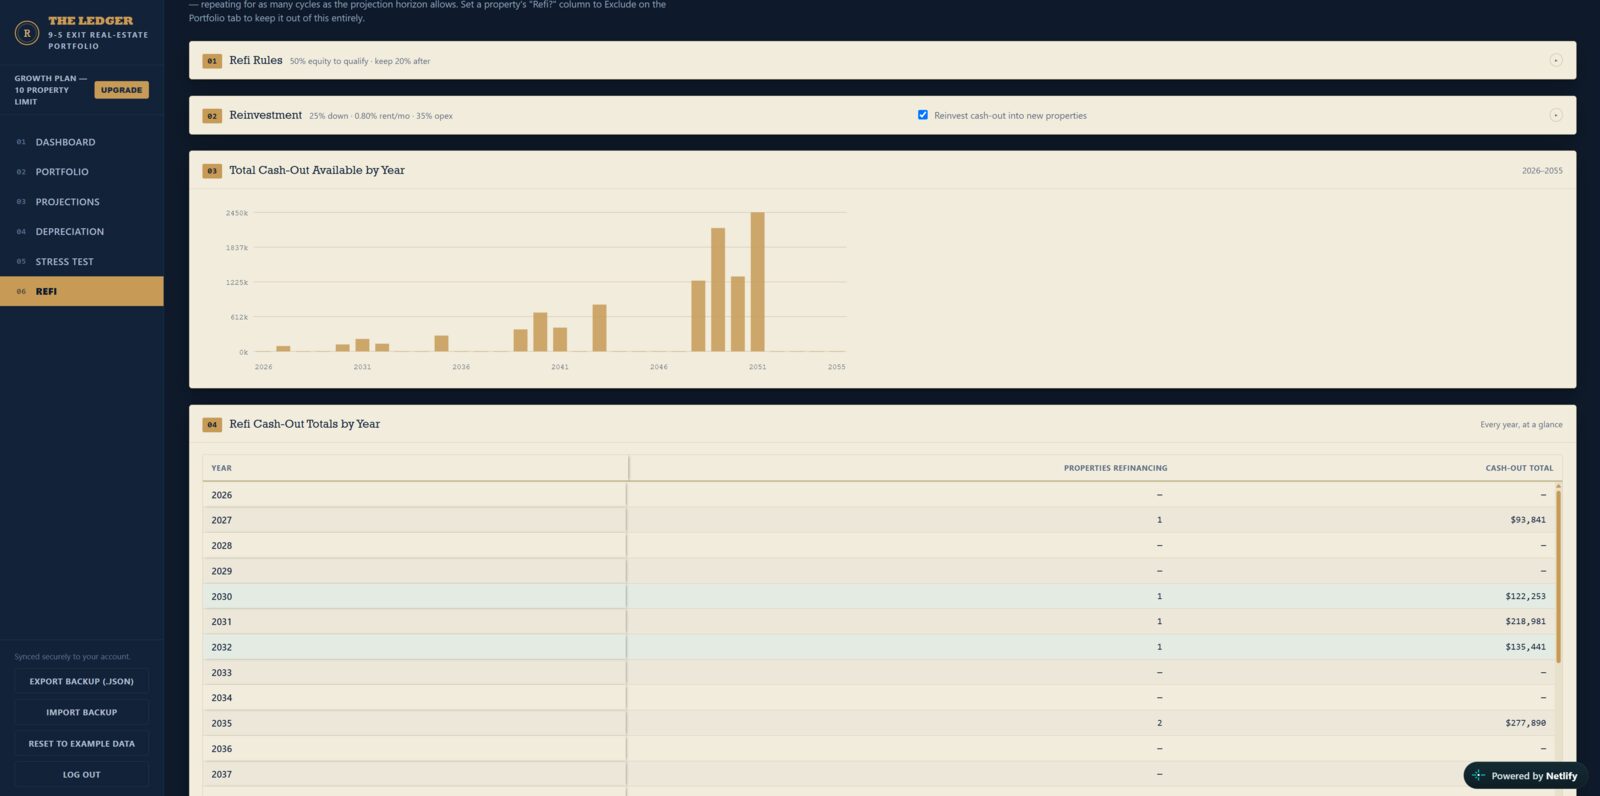
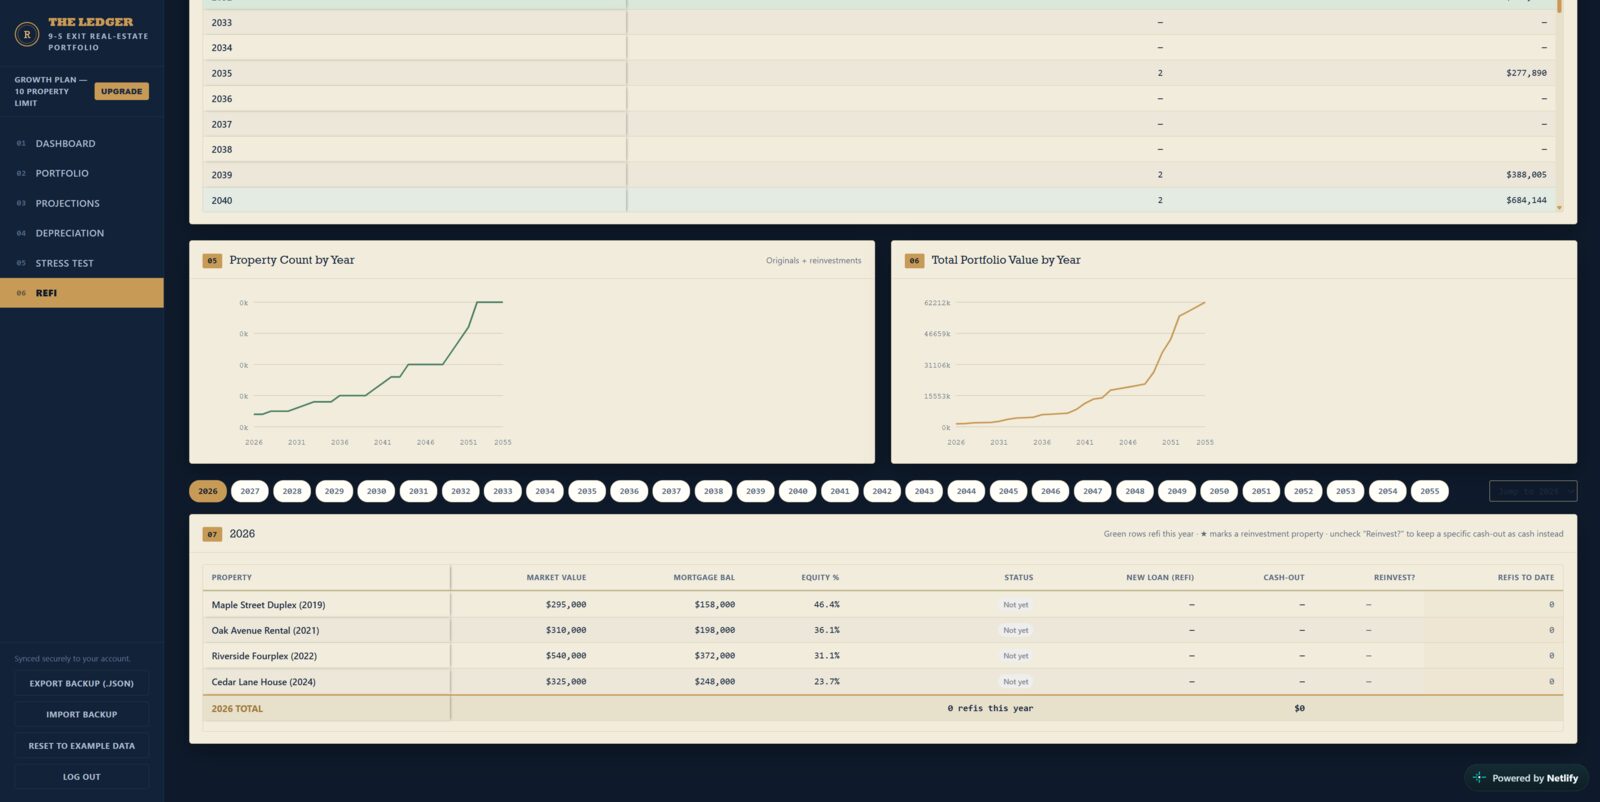
Refi tab showing refinance rules, reinvestment settings, and a chart of total cash-out available by year
Refi tab continued, showing property count by year and total portfolio value by year charts alongside a detailed year-by-year reinvestment table
05 · Depreciation

The Unglamorous Number, Already Calculated

Full IRS straight-line depreciation schedule for every property, every year — ready before your accountant asks.
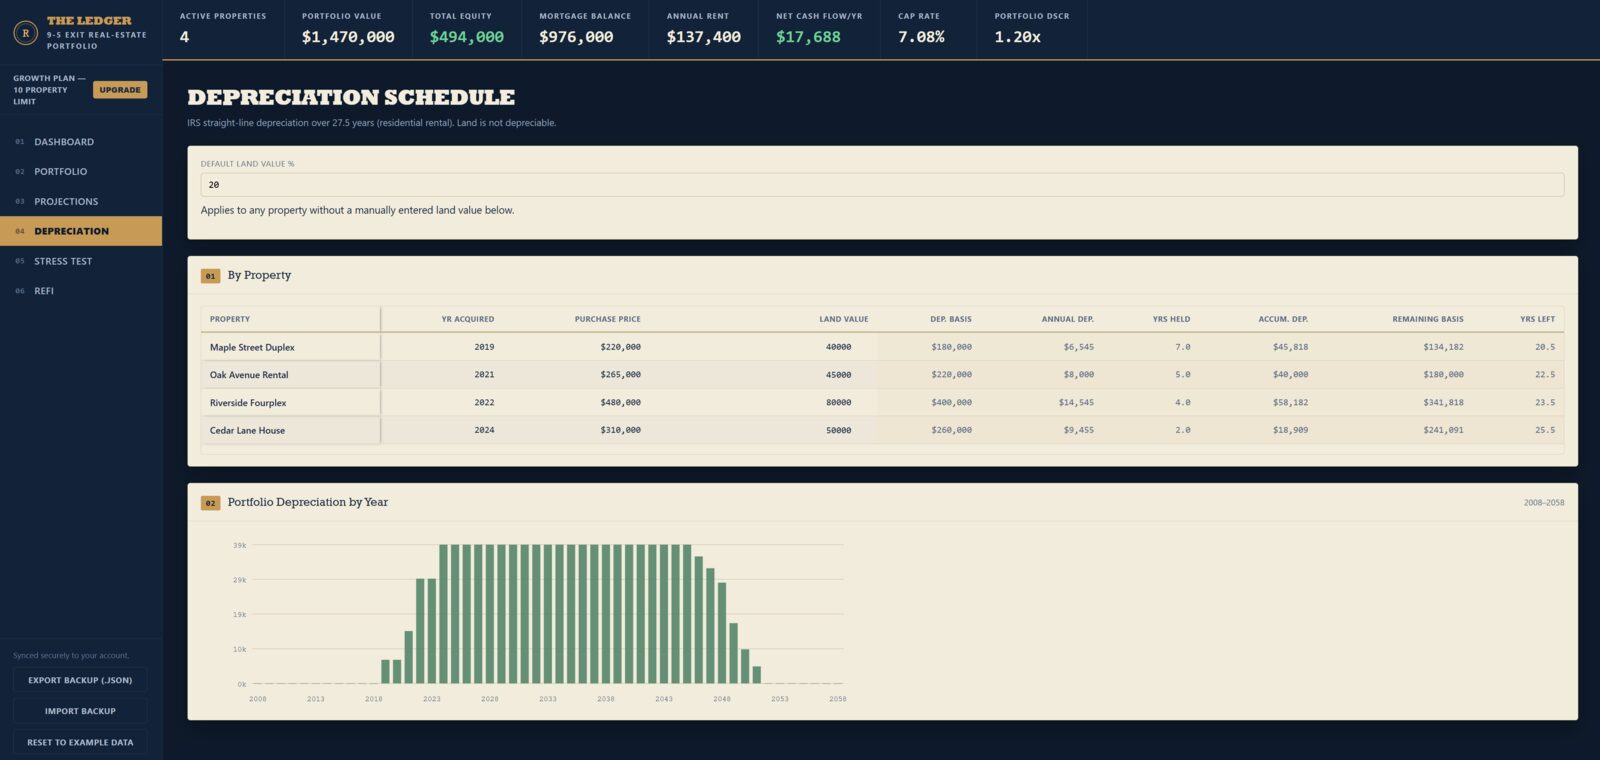
Depreciation tab showing IRS straight-line depreciation schedule by property and a portfolio depreciation by year chart
Who This Is Actually For

Not Everyone Needs An Exit Number Yet.

You own 1–2 rentals

Free tracks both properties and builds the habit before the number matters financially.

You're actively growing

Growth's 10-property cap and refi simulator are built for exactly this stage.

You're close to the number

This is when the stress test and depreciation schedule stop being optional.

Stop Guessing. Start The Ledger.

Free for your first two properties — the same engine your exit number will eventually run on.

Start Free — Build Your Ledger