The model that shows how refinancing equity and reinvesting cash flow compound your portfolio into financial independence.
Log your rentals once. The Ledger projects 30 years of cash flow, flags every refinance opportunity, and automatically reinvests the proceeds — showing you the exact year you can quit.
Free plan tracks up to 2 properties. No card required.
Most investors track their rent roll. The ones who escape their jobs model what happens when every dollar of equity gets put back to work.
Your portfolio's future — modeled in the time it takes to enter your first property.
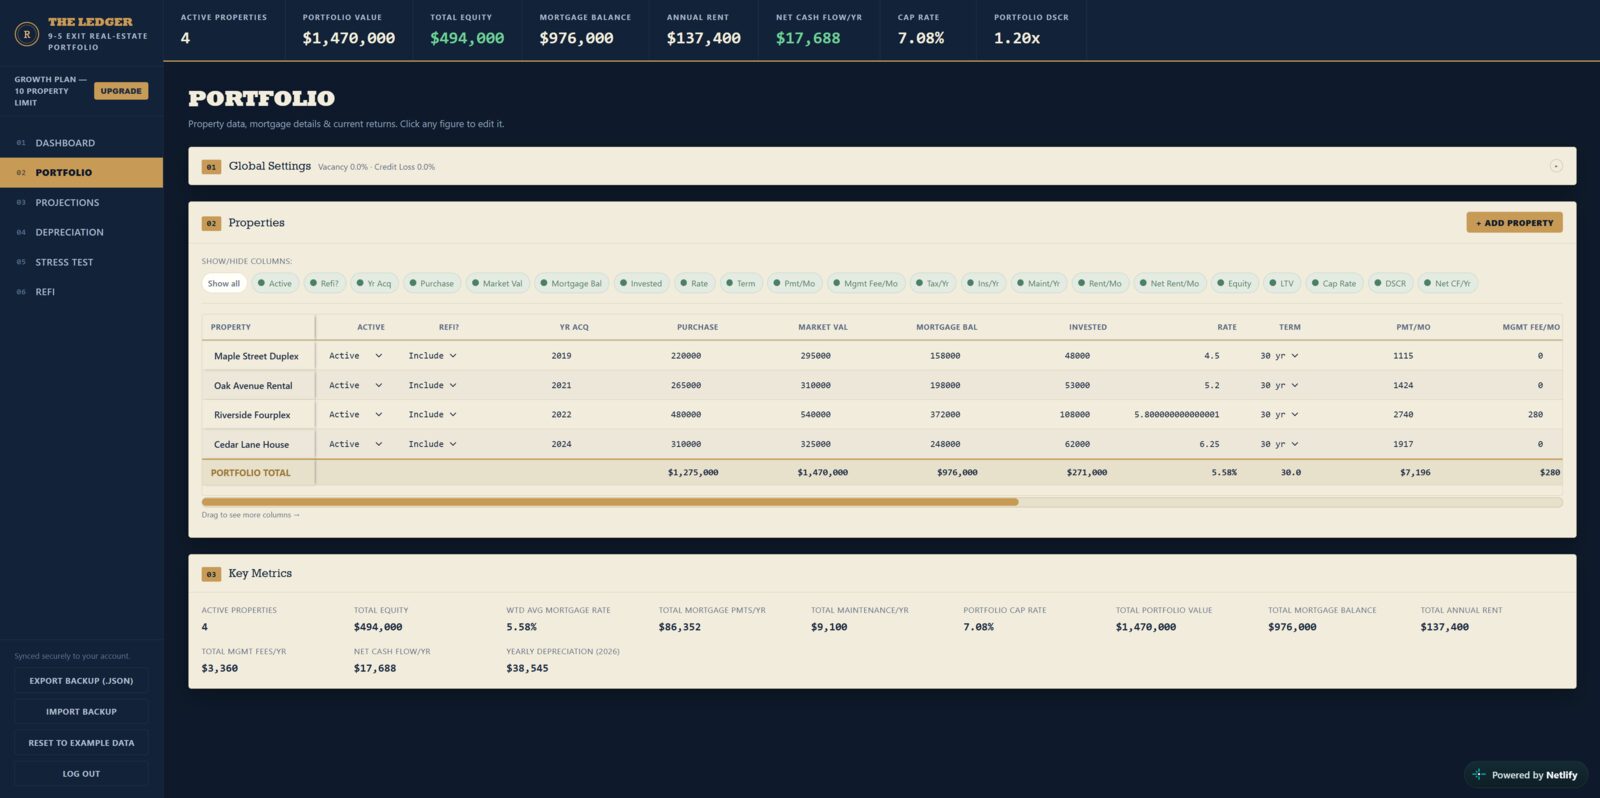
Enter purchase price, rent, mortgage, and expenses. Live Freddie Mac rates pre-fill your interest field automatically.
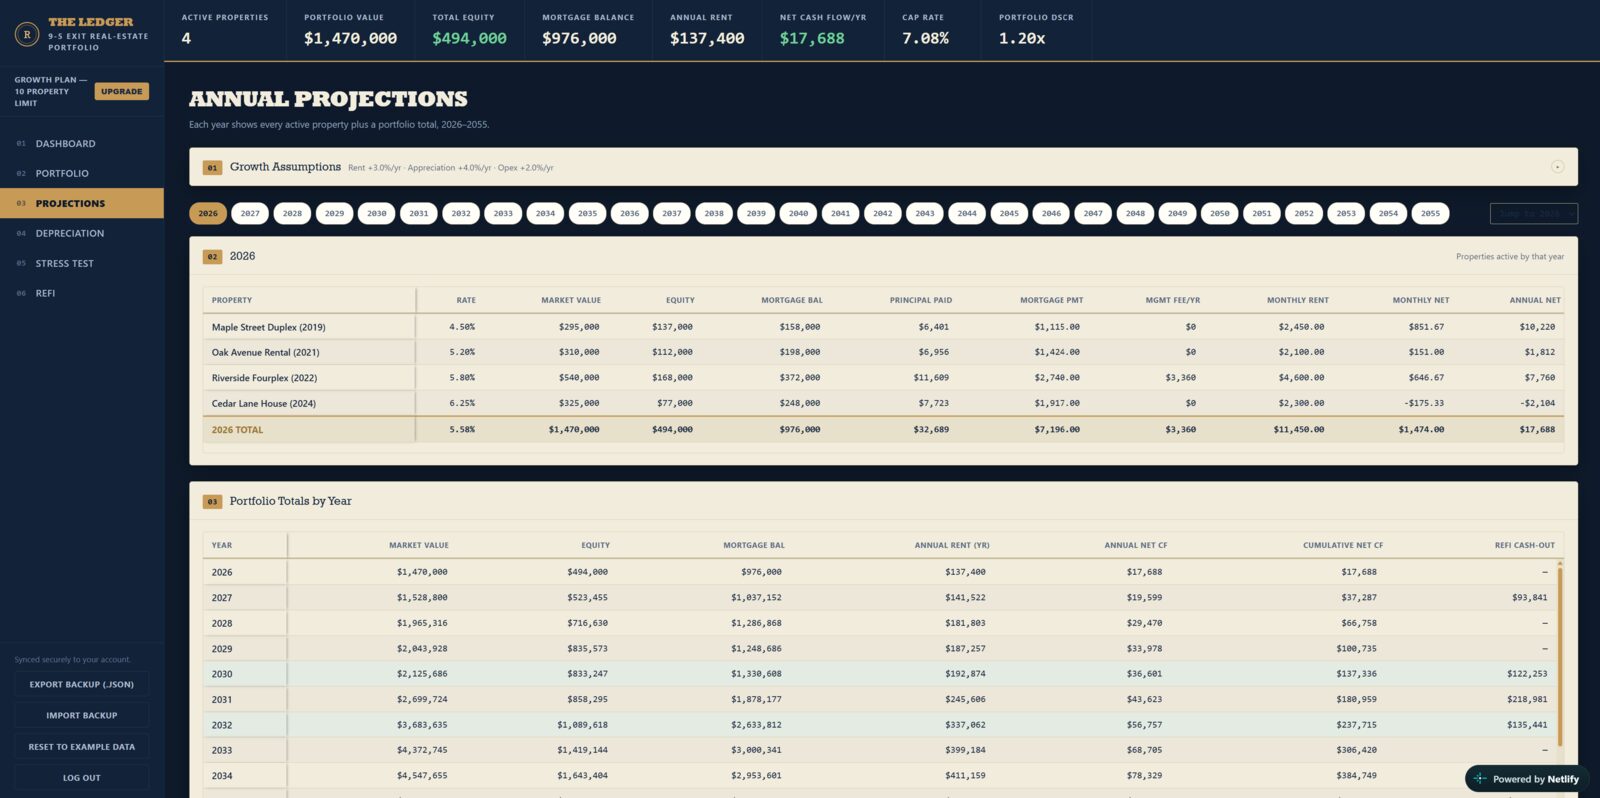
Every year's cash flow, equity, value growth, depreciation, and return — projected instantly on a single screen.
The Equity Ready to Pull Out list flags every property you own enough of — and shows exactly how much cash each can free up.
Cash flow and refi proceeds automatically fund the next down payment. The 30-year trajectory chart shows when your portfolio replaces your paycheck.
Keep adding properties and recycling equity until the portfolio replaces your paycheck. The Ledger shows exactly how many properties away you are — and which year you cross the line.
Simple rental income grows linearly. Equity recycled through refinancing and reinvested cash flow grows exponentially. The Ledger models both — and shows you the difference.
Every mortgage payment chips away at the balance. Rising values add to the top. Your properties quietly build a balance sheet most investors never fully see.
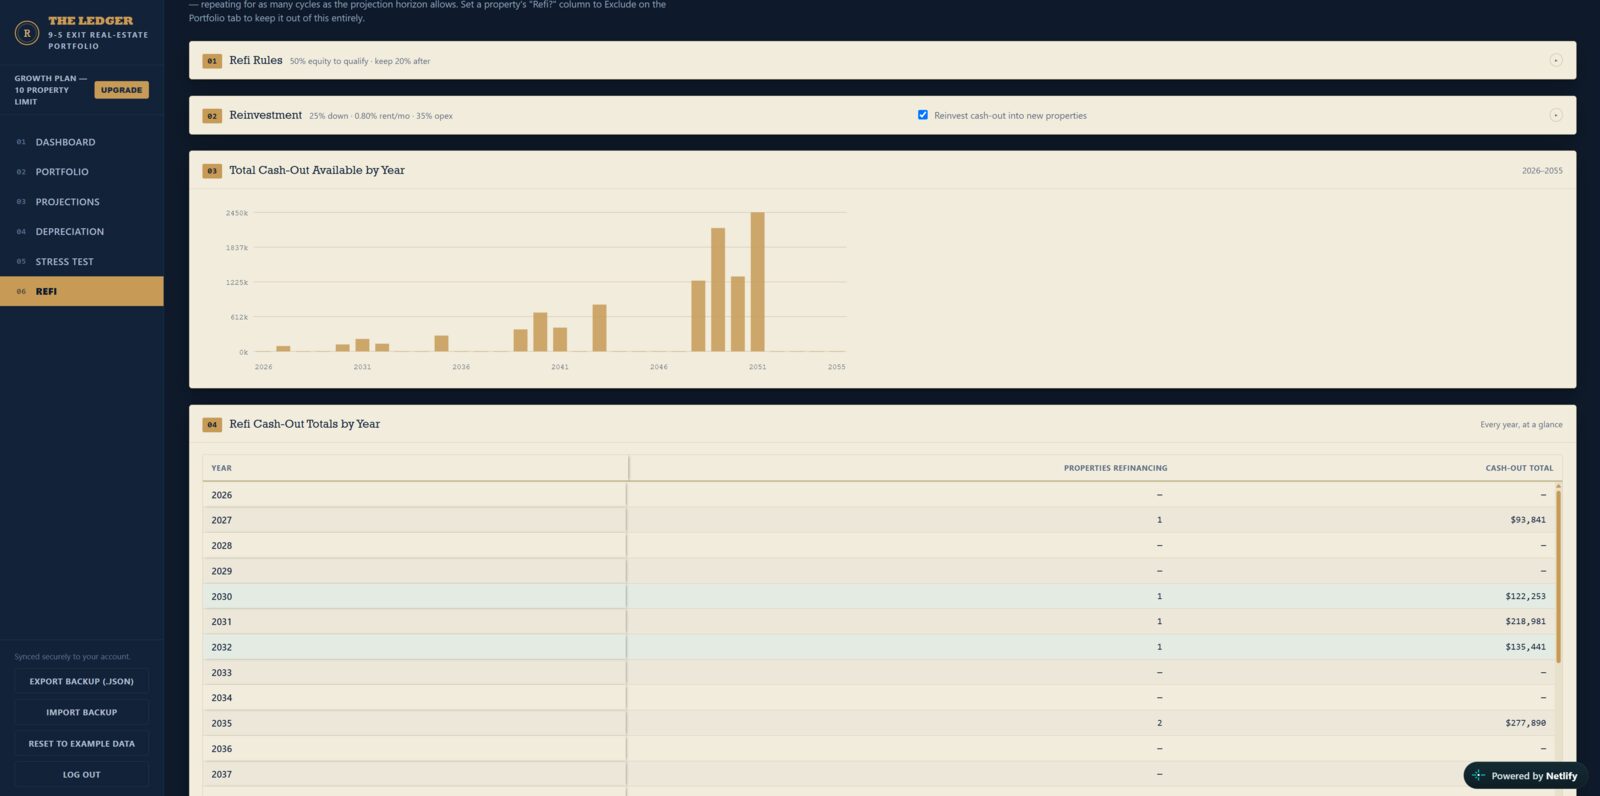
When you own enough of a property, The Ledger flags it. The equity you pull out goes into savings — ready for the next down payment.
Refi proceeds and pooled cash flow combine into the next down payment. The new property starts throwing off rent — and the cycle accelerates.
Sorted by how much you own, the list shows which properties are ready now, how much cash each produces, and whether the rate makes a refi worth it.
Every year of positive cash flow pools automatically. The moment there's enough for a down payment, the model buys the next property — without you lifting a finger.
The 30-Year Outlook charts show equity and net cash flow curving upward as refi and reinvestment kick in — and the year your portfolio crosses your freedom number.
Seven tabs. Every number your exit plan needs — from today's portfolio snapshot to year 30 of the projection, refi and reinvest or pay it down.


The exact demo portfolio shown throughout this page, run forward through the model — not a different hypothetical investor.
The same 4 properties shown throughout this page — $860,000 in value, netting $3,077/mo today. The goal is $6,000/mo. That's 51% replaced — not close enough to quit yet.
Set it to pull out equity once you own 50% of a property — the same default used everywhere on this page. Cedar Court Condo is already past it, so the first refi fires right away. Oak Avenue House follows in 2027, Maple Street Duplex in 2028.
Here's the part most calculators hide: cash flow dips at first, from 51% to about 48%, because each refi trades equity for a bigger loan payment. That pulled-out equity isn't lost — it's sitting in the pool, waiting to become down payments.
Then it turns. Pooled equity and cash flow buy three properties by 2029 — seven doors, 85% replaced — and every new property starts building equity for the next refi.
The ledger shows the crossing in 2030. Hold the same 4 properties and do nothing, and you're only at 65% that year — and don't cross until 2039. The refi + reinvest loop is the difference.
One honest caveat: this assumes every new purchase rents for 1% of its price each month. Those deals are hard to find in most markets today. At a more typical 0.8%, the same portfolio crosses in about 2035 instead. Why the 1% rule rarely works now →
Figures are illustrative and generated by the model's assumptions, not a guarantee: 3% yearly rent growth, 4% appreciation, 2% expense growth, 5% vacancy and 1% unpaid rent; refinancing at 50% owned while keeping 25% equity (a 75% loan, the usual conventional limit); new purchases at 25% down and 7% interest, renting for 1% of price each month (the classic “1% rule”). Your own numbers and exit date depend on the properties and assumptions you enter.
Built for investors who want the full picture — not just rent minus mortgage.
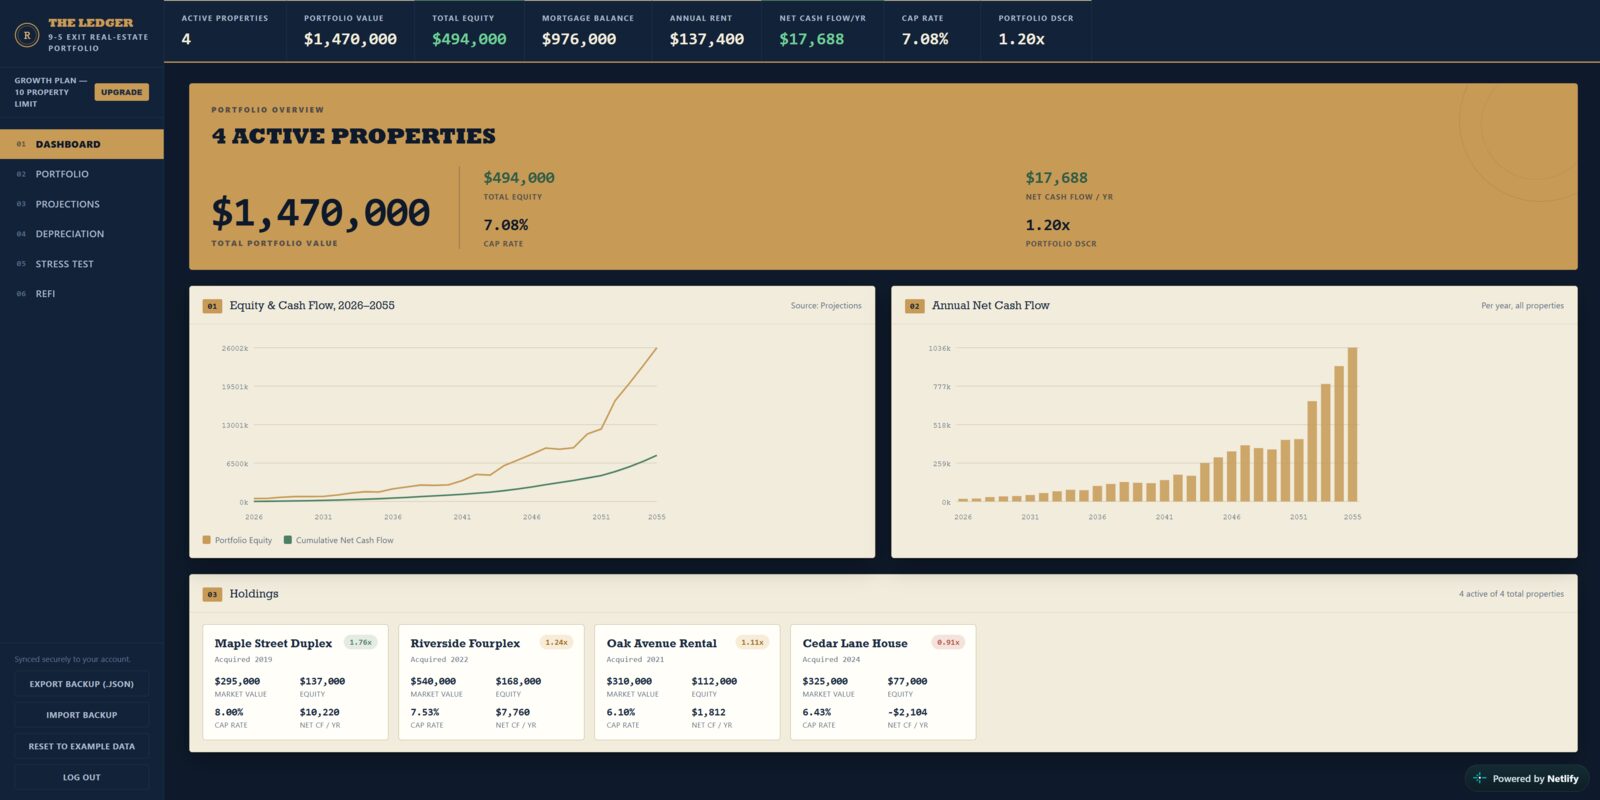
What it's worth, total equity, money left over each month and year, and return — across every active property, always current.
Equity and cash-flow curves projected to 2055. Property cards show where each one stands this year. The refi and reinvest loops run automatically.
Sorted by how much you own. See which properties are ready, exactly how much equity each can pull out, and whether a rate reset makes the refi worth running.
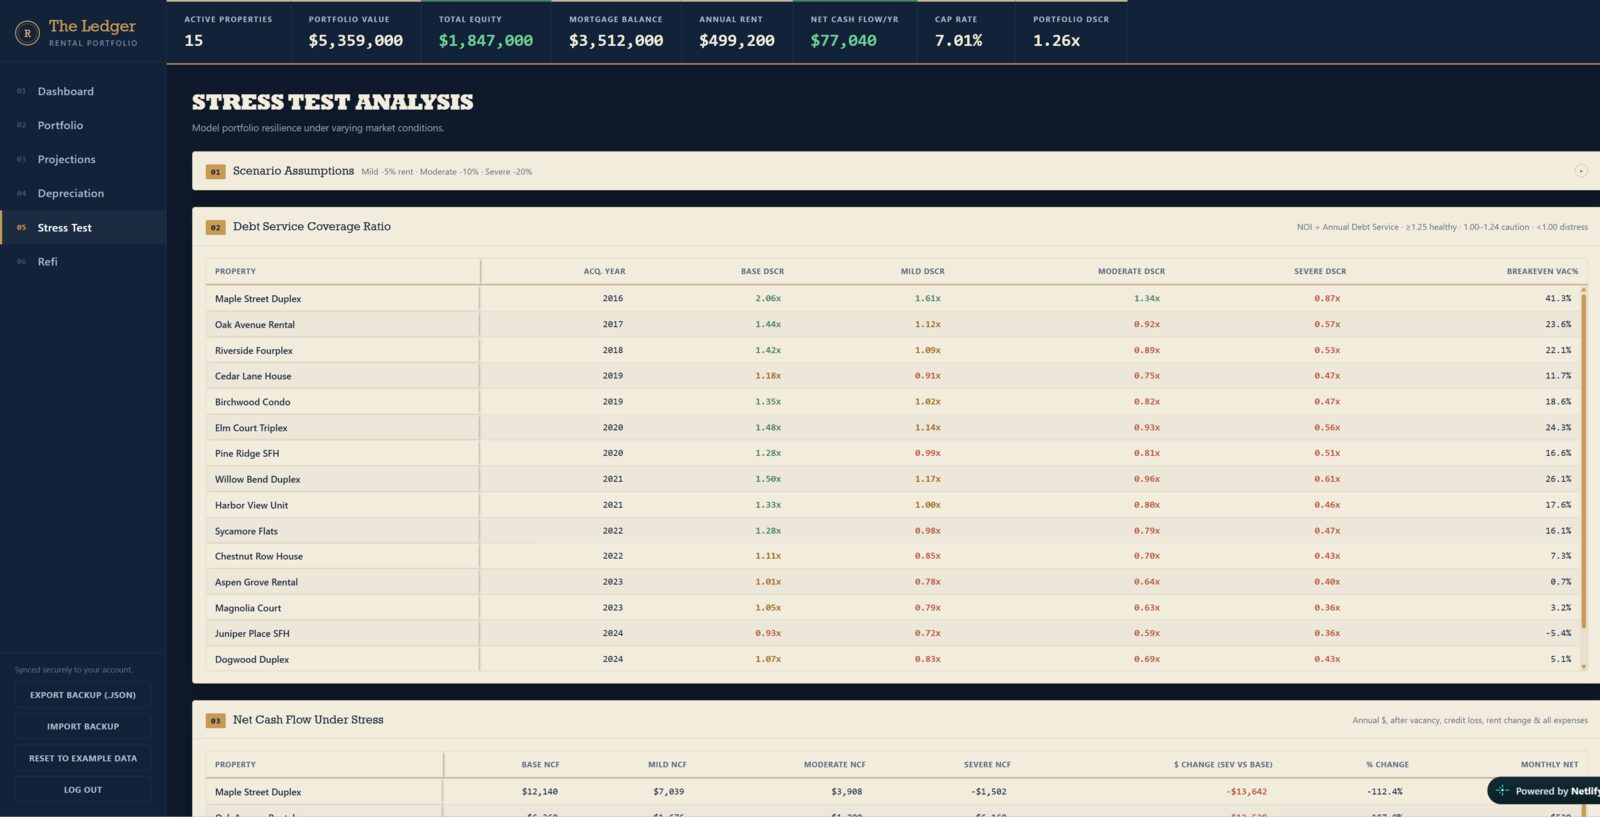
Lower the rent, leave units empty longer, and see which properties still make money. Know your margin before a bad year arrives.
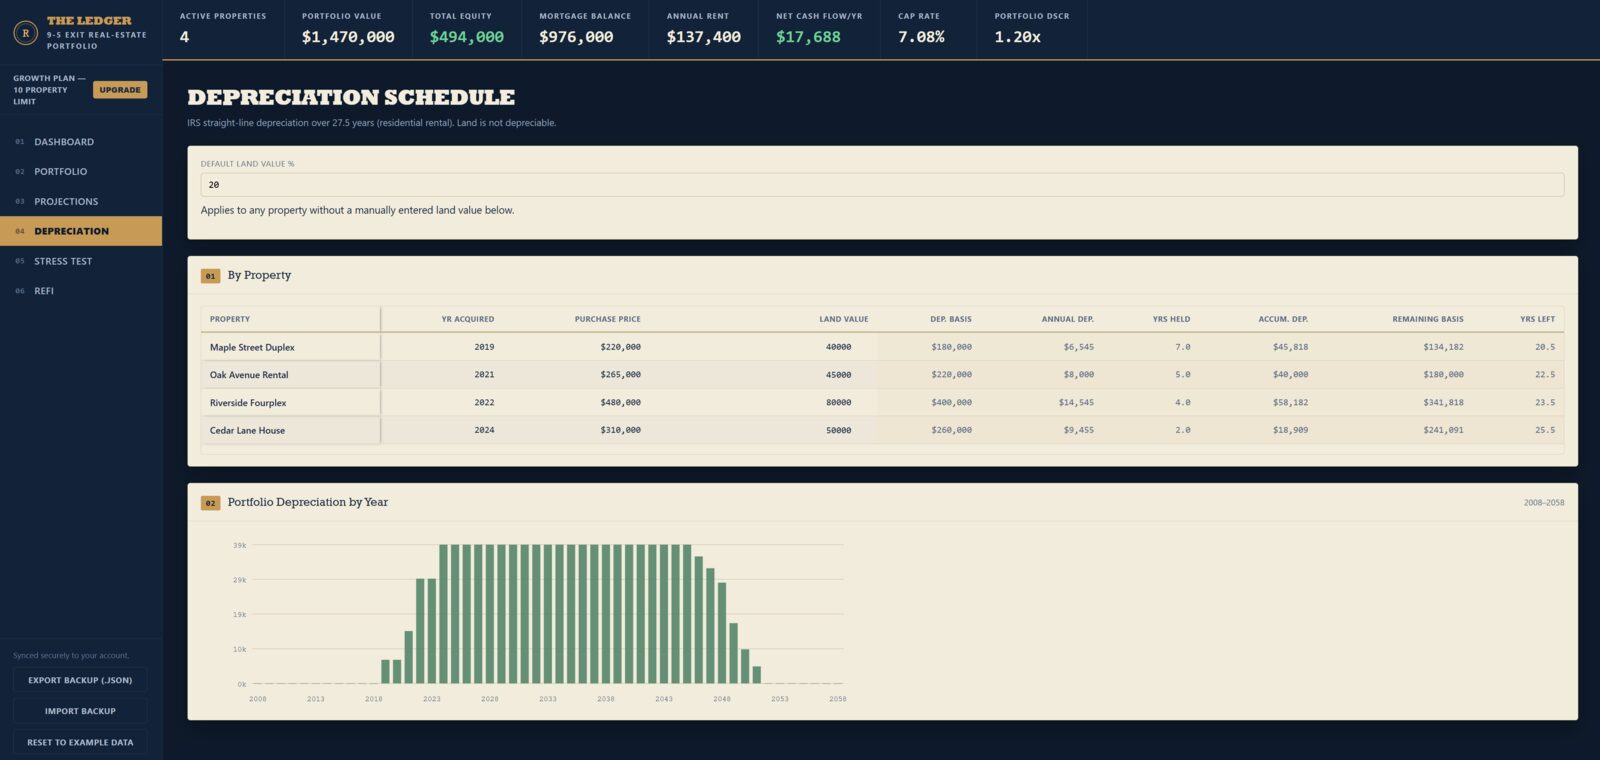
Every year's depreciation calculated and tracked. The tax advantage that turns cash-flow-positive rentals into paper losses — modeled properly.
The purchase editor pulls the current Freddie Mac 30-year rate automatically. Always modeling with the real number, not a guess from last year.
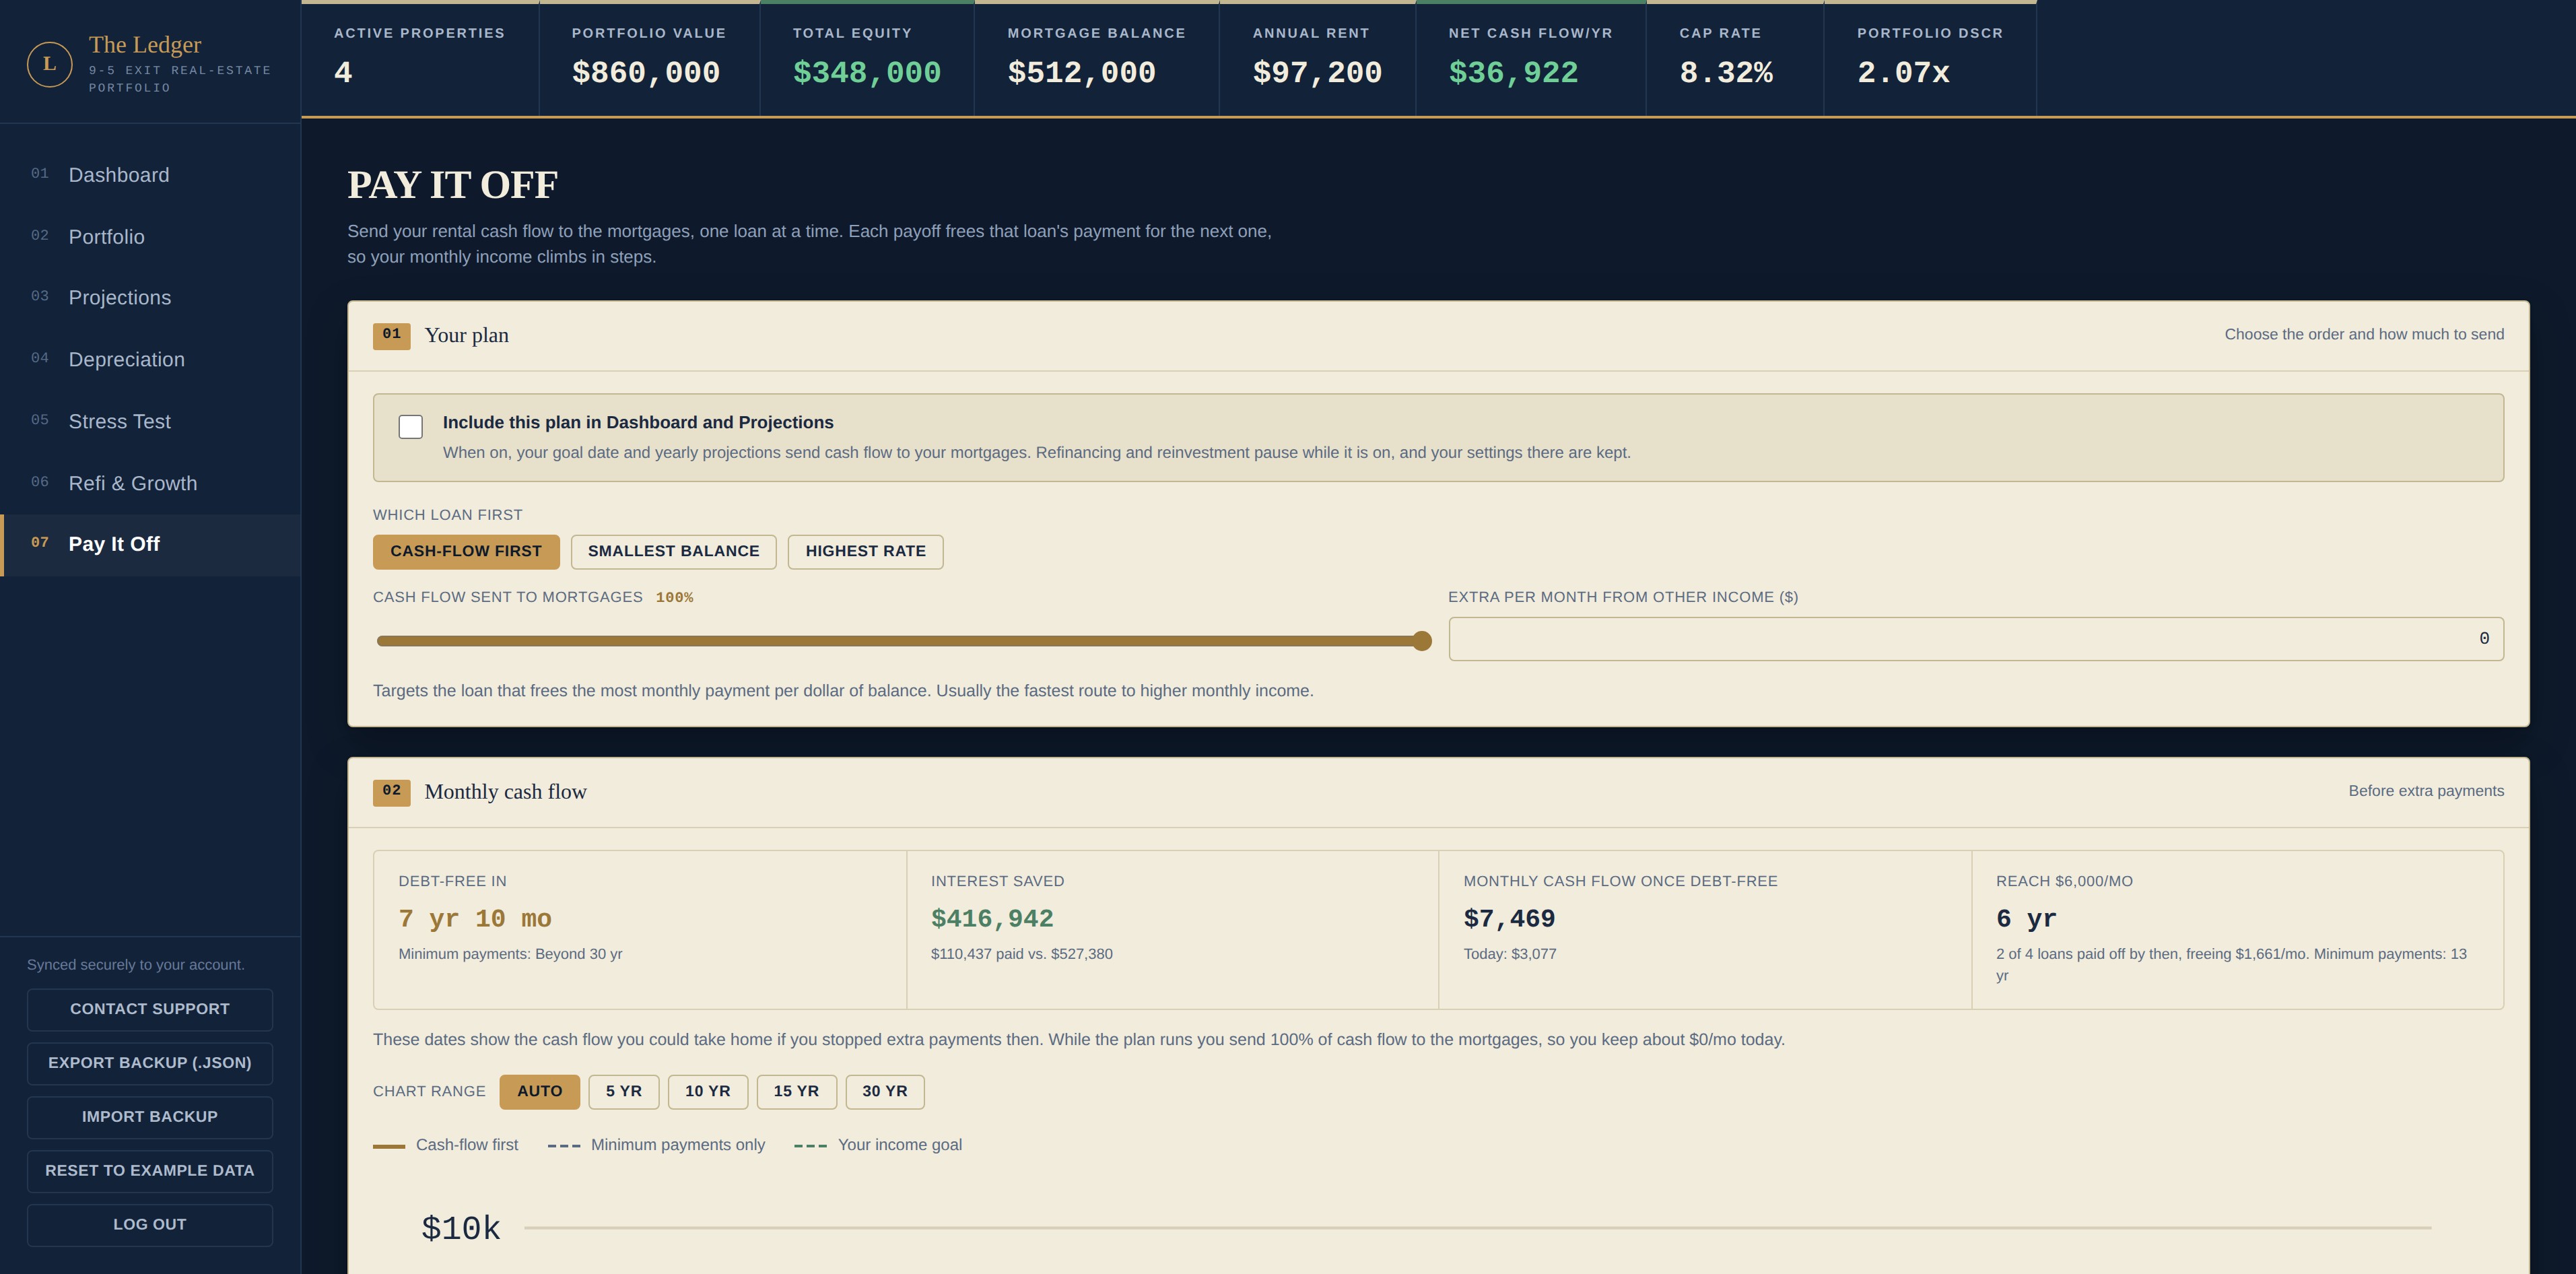
Reinvesting isn't the only exit. Send cash flow at your mortgages instead, pick which loan goes first, and see the exact year you're debt-free — and what your income looks like once you are.
Refinancing doesn't have to fund the next property. One toggle sends the equity you pull out to you instead — with this year's total and a running total, tracked automatically.
Upgrade only once you're ready to add more than that.
Already have an account? Sign in · Payments securely processed by Stripe.
You choose how much of a property you need to own first — say, 50%. The model tracks how much you own of each property year by year. The moment a property crosses that line, the simulation refinances to pull out equity: it calculates the proceeds, resets the mortgage balance, and adds the cash to the down-payment pool. You see it happen on the Projections tab and in the Refi Action Queue.
Every year your portfolio throws off positive net cash flow, the model pools it. Once pooled cash equals a configured down-payment amount, the simulation buys the next property — adding its rent, equity, and depreciation to every subsequent year. Over a 10-year horizon, this compounding effect is often the biggest driver of portfolio growth.
Yes — the Pay It Off tab models that path instead. Pick which loan to attack first (the one that frees the most cash flow, the smallest balance, or the highest rate), and see your debt-free date, interest saved, and monthly cash flow at 5, 10, 15, and 30 years out. One switch runs the plan through your whole account; refinancing pauses while it's on so the two strategies never mix by accident.
No. The Ledger runs the math on the numbers you enter — rent, mortgage, expenses, appreciation assumptions. It doesn't tell you what to buy, sell, or refinance. That call stays yours.
The Unlimited plan removes the property cap entirely for $50/month. You can upgrade the moment you need to, right from your account.
Yes. Every property, projection, and paycheck number is scoped to your account only — no one else's login can see it, by design.
The number is your portfolio's net cash flow — rent minus mortgage, taxes, insurance, maintenance, management, empty months, and unpaid rent. It is pre-income-tax. Rental income is often taxed favorably thanks to depreciation (which the ledger tracks separately), but if you want a conservative target, set your freedom number higher to build in a cushion.
Yes, from inside your account, whenever you want. No contracts, no phone call required.
I've been a real-estate investor for 15 years, quietly working my way toward my exit number. In the summer of 2025, I was diagnosed with brain cancer. After 90 days in the hospital, and nearly a year in recovery, I'm grateful to say I'm now in full remission.
Having left my job, I suddenly found myself with time on my hands — and an old question I'd never fully answered: exactly how many rental properties would it take to quit for good? So I built the all-encompassing model I'd always wanted, first just for myself.
I quickly realized the real power was in the interplay of reinvesting, refinancing, and depreciation — how they compound together over decades in ways a simple calculator could never show.
What you see here is that model — expanded, refined, and opened up to share with everyone chasing the same freedom.
Plain-English answers to the questions every rental investor asks on the way to quitting.
The seven-step formula, with a full worked example on a $250K rental.
Read the guide →Find your freedom number, do the naive math, then see why it's wrong.
Read the guide →Why refinancing and reinvesting compress the timeline instead of stretching it.
Read the guide →Two words that sound alike, work in opposite directions, and both shape your real return.
Read the guide →Why the classic rental screen rarely works at today’s prices and rates, and what to use instead.
Read the guide →Cash-out vs. rate-and-term, lender limits, and a worked example of refinancing into the next property.
Read the guide →Start free. Log your properties. See the year the refi + reinvest flywheel carries you across the line.
Start Free — Build Your Ledger